
It has long been said that "You can't improve what you don't measure."
We’re excited to introduce New Membership Analytics! It’s now much easier to measure your membership data, and analyze your patient growth, attrition, and membership composition.
How is Your Practice doing?
This new feature allows you to see how well your practice is doing at a glance.
You can dive deeper on specific factors such as growth, attrition, or active memberships and even break out the data by provider, plan, employer, age group or gender to get a better understanding of your business drivers and potential problem areas.
One of our goals at Hint Health is to make your practice data available to you in the clearest possible way, to help you run and optimize your business. We hope this new release helps you better analyze your business.
How it works
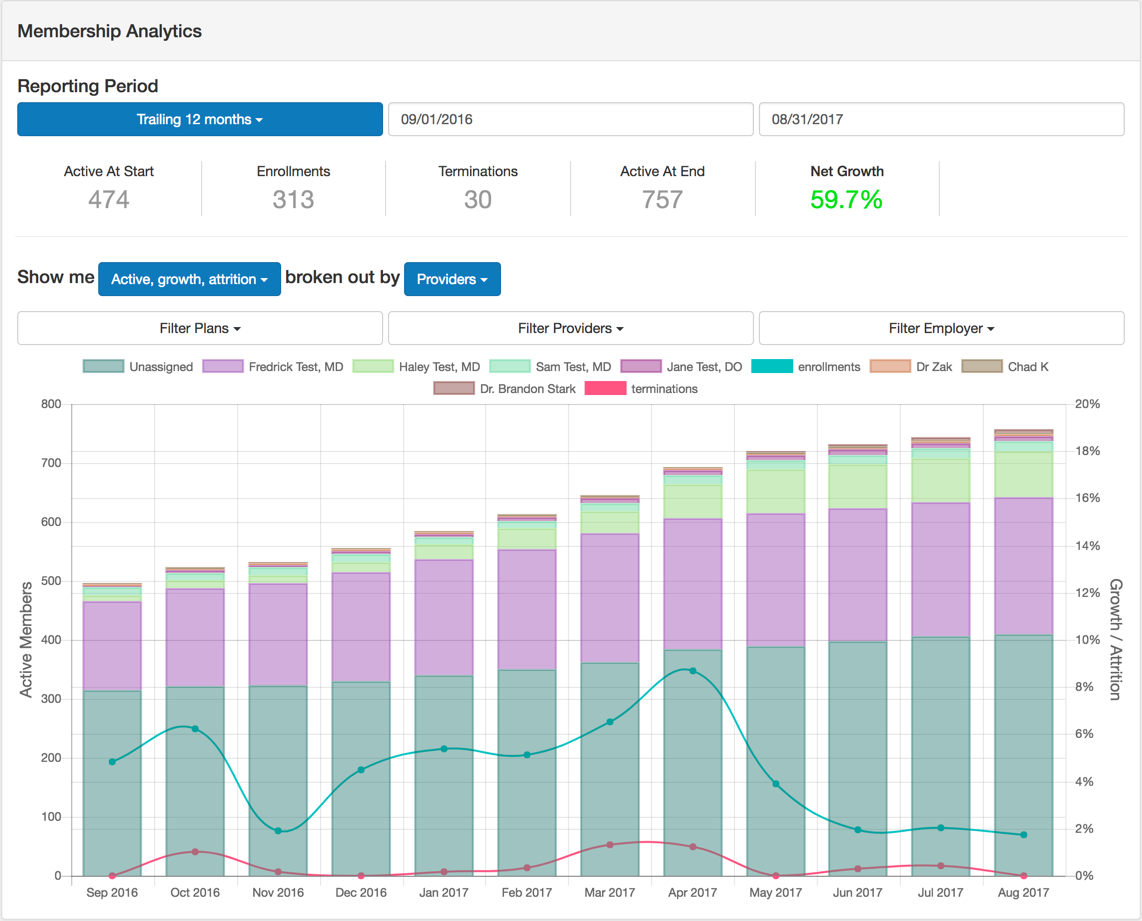
To view the membership analytics report, click on “Reports” at the top of the page, and then click “Dashboard”. The default reporting period is 12 months, but you can change the reporting period to whatever you’d like.
The default display shows active memberships represented as bars, with enrollments and terminations overlaid on top as lines. Click on the “Show me” drop-down to change the default view and focus on just active memberships, enrollments or terminations.
You can also click on the “Choose breakout” button to see your data broken up by provider, plan, employer, or employer vs. retail (breakout by gender and age group coming soon).
Lastly, use the filters to hone in on a particular dataset that you’re interested in, such as a specific provider or plan.
Use a combination of filters and breakout to answer questions such as: How many terminations has each of my providers experienced in the last 6 months for the “premium” plan?
Send Us Your Feedback
As always, we’d love to hear your ideas about how to make this feature even better. Please share your thoughts by posting a comment below or reaching out to product@hint.com.
.svg)